17 May 2026
Towards approachable observability with wide events
A tragedy in four acts
I like to think about how to get operational insights into the services I host. It’s become kind of a hobby, to be honest. Maybe this whole thing is just bike shedding. What better way to avoid the crushing reality that an actual project you had in mind doesn’t live up to your expectations than by not even attempting it, and instead building infrastructure around your existing applications? Maybe that’s a topic for therapy.
Anyhow, I realized during my latest manic observability episode that I barely even remember how I got here. So for posterity, I’m outlining the history and motivations for all the different phases in this note.
Act 1: Metrics and Prometheus
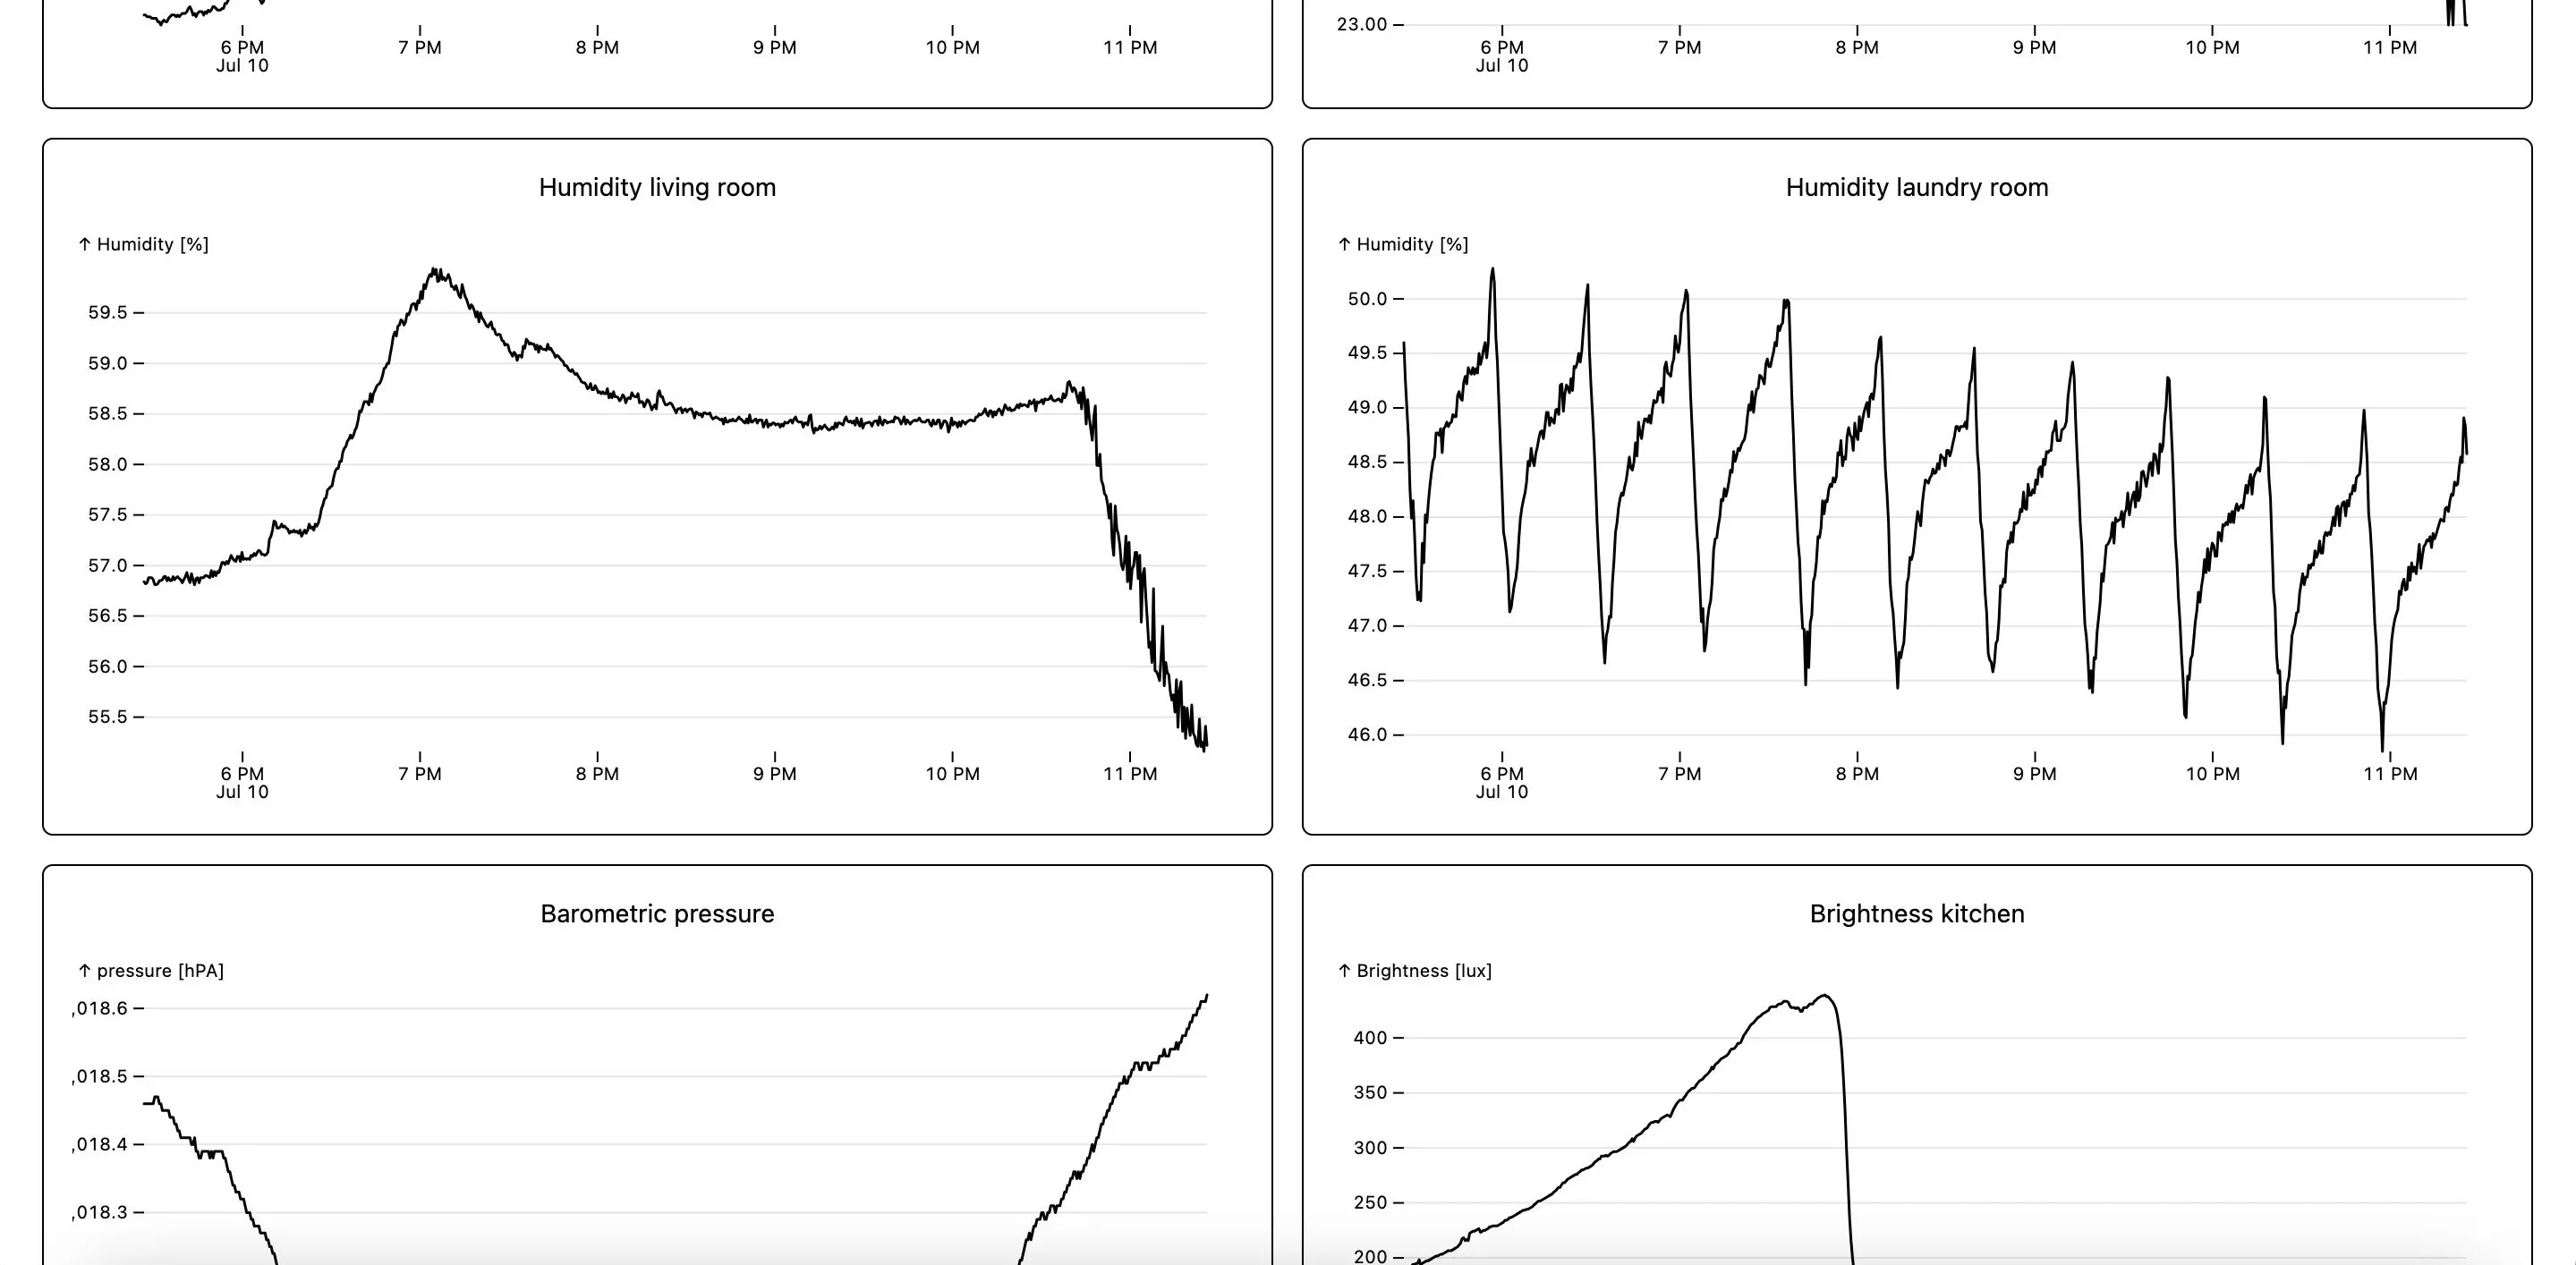
A couple of years ago I got the itch to play around with embedded devices. I got myself an ESP32 and a CO2 sensor and got to work. With a little elbow grease, I had the current CO2 concentration displayed on a small seven segment display. Soon, I graduated to wanting to store and chart this data.
At this point I had little knowledge on how to approach this, so I went the well-trodden path: Prometheus to store time series data and Grafana to visualize it. Since my microcontroller was not internet accessible, I had to put a push gateway in front of Prometheus to allow pushing data into the system, instead of having Prometheus scrape the metrics off the device on a regular schedule.
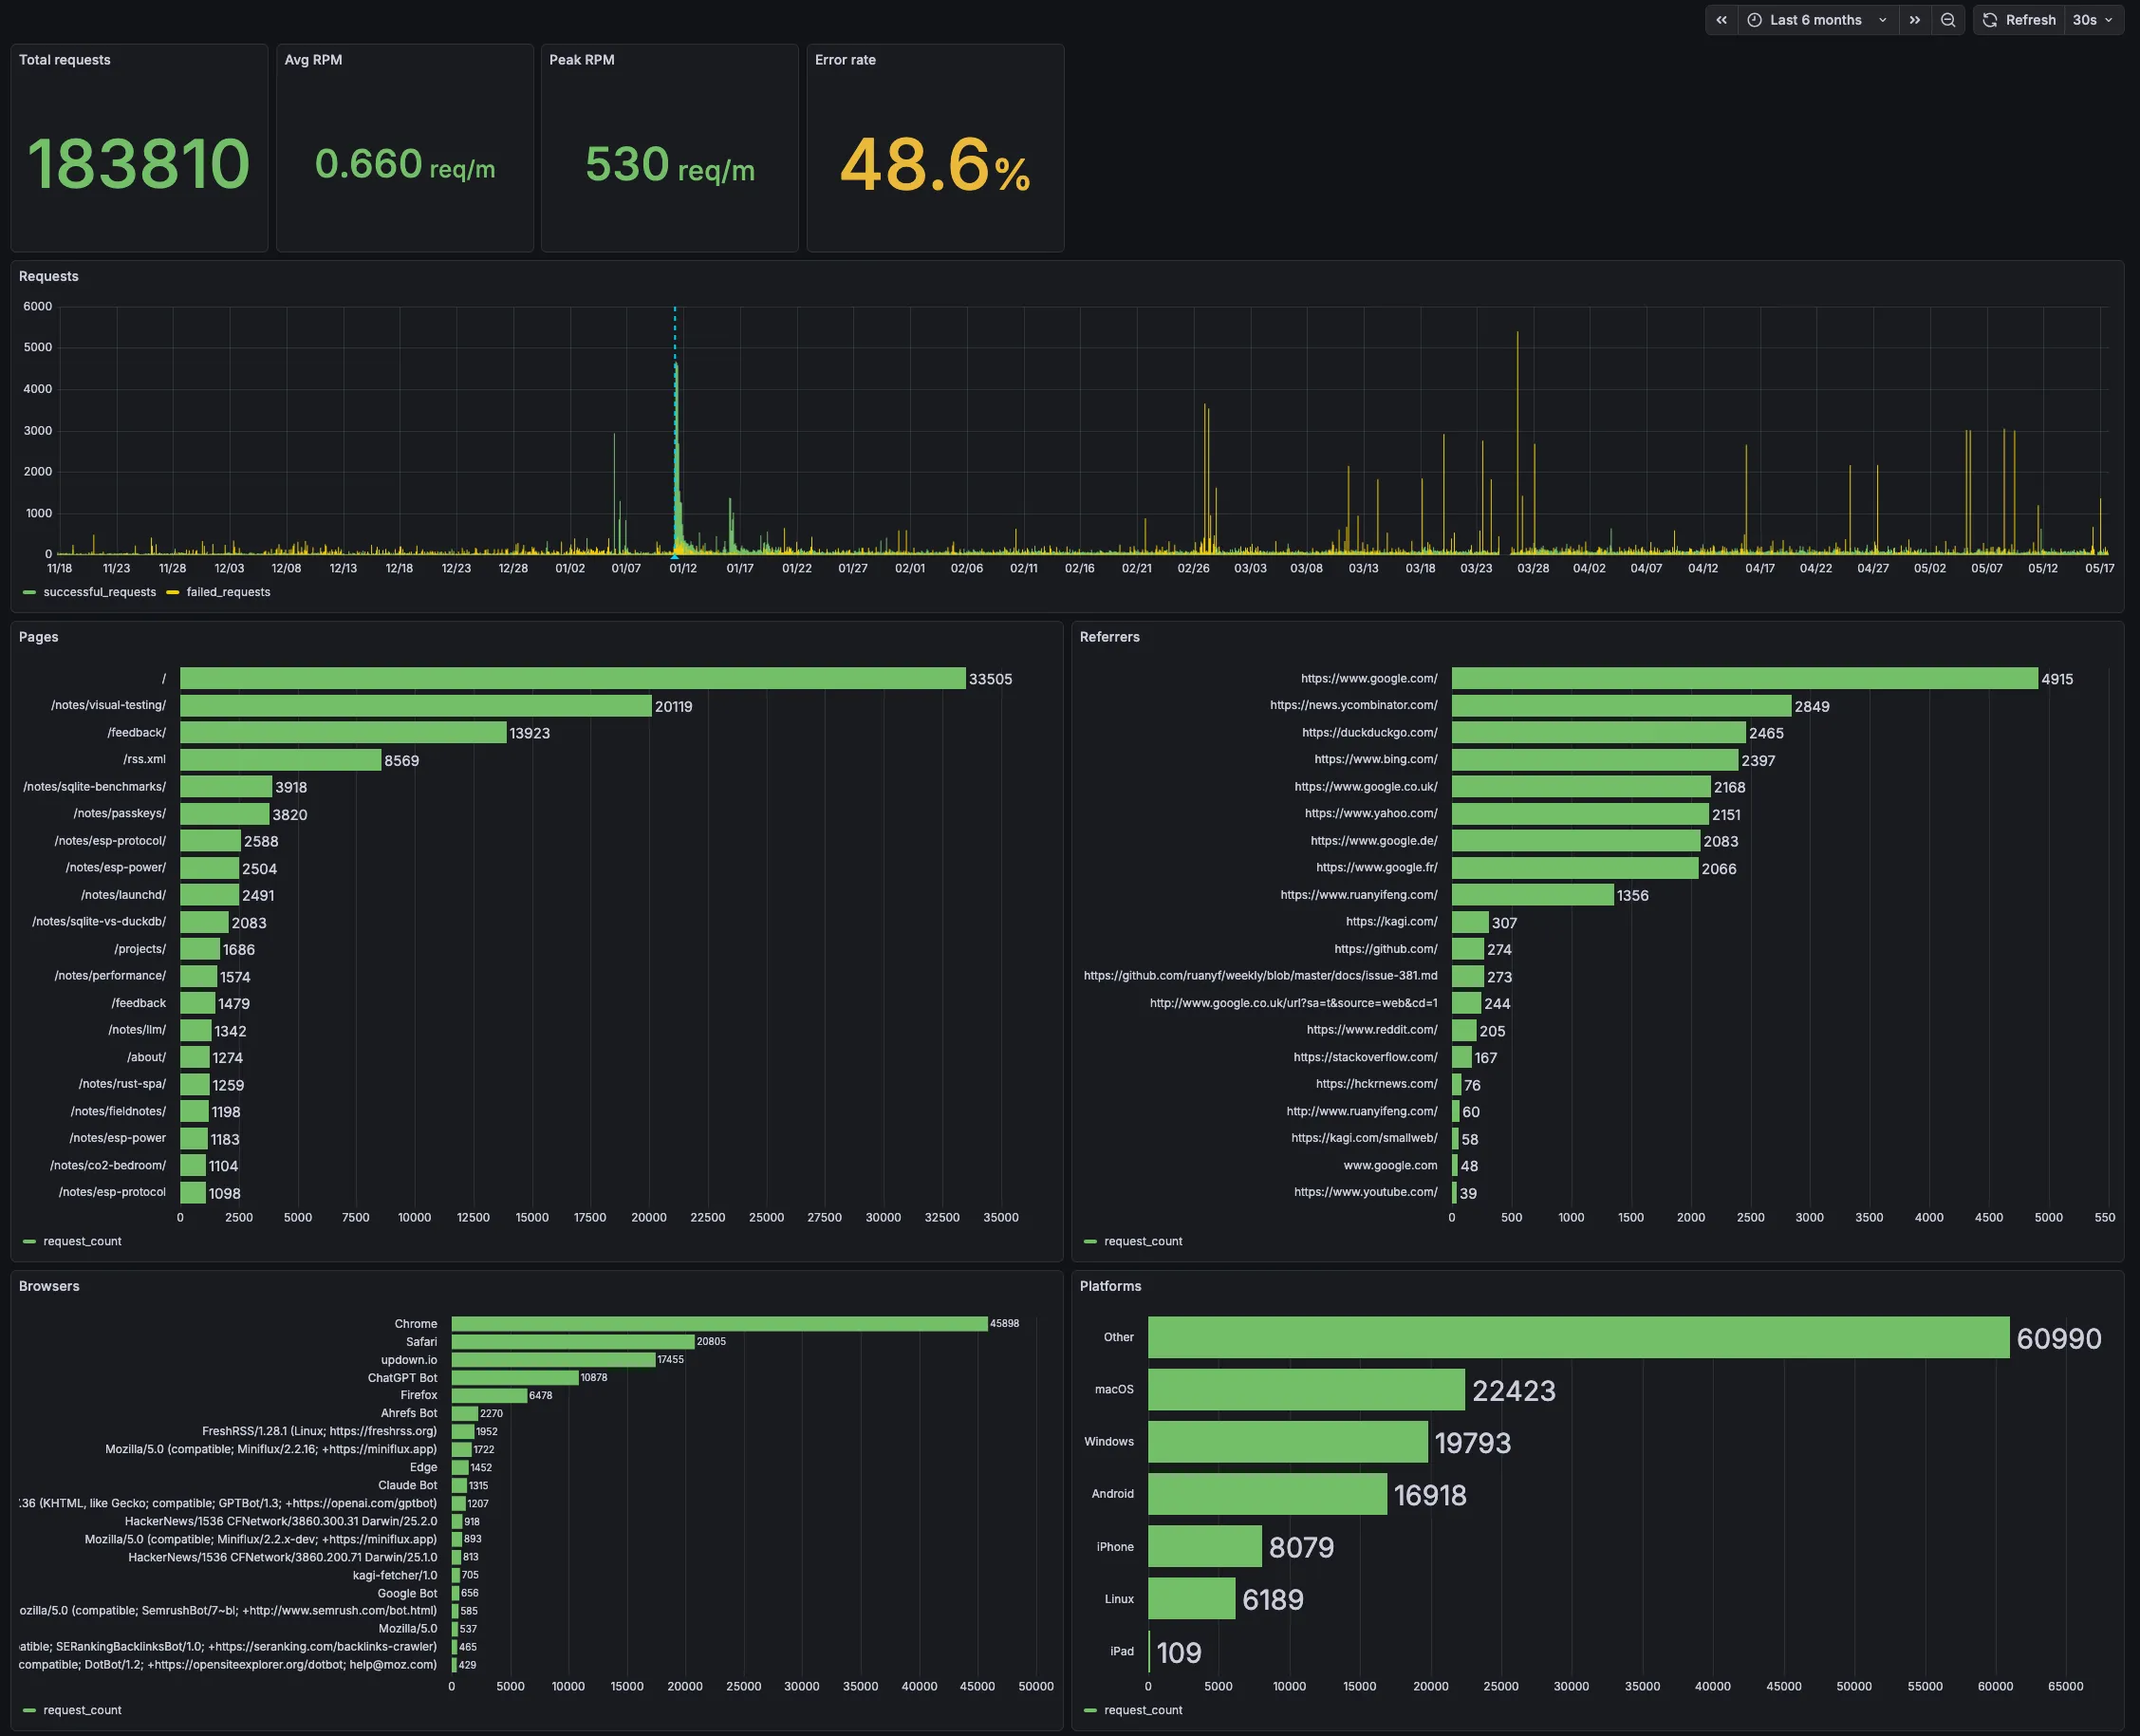
Around this time I also built and deployed this website. I had seen a cool statistics section on another blog, where one could view how many page views the blog was getting and which pages were popular. Wanting the same for this site, I initially transformed the static site into one with a NodeJS backend just for this feature. After a short while I realized I wasn’t happy with that and ripped it out again, planning instead to track visitors with an external service. You can watch this unfold in this old note.
I could have used my existing Prometheus setup to scrape Caddy for access metrics, but that wouldn’t have given me all the data I wanted. I’d need a dedicated service serving the site and exposing metrics. So this kicked off the realization that I needed a broader observability system than what Prometheus could give me. What was always clear to me, by the way, is that I wanted one unified system for metrics and service monitoring.
In hindsight, I also realize there was another push factor: PromQL. I got annoyed with learning a language with such a narrow use case.
Act 2: Metrics with DuckDB
With all this in place, the time was ripe to venture out. And boy did I. The requirements for my next system were clear: it should accept arbitrary JSON payloads (like sensor readings or access logs), store them efficiently, and allow querying them in an ergonomic fashion.
Notice the shift away from time series data to something more general, something that could cover multiple use cases. You can follow the journey from musing on how to store that data to benchmarking suitable databases in my notes.
Coming away from PromQL, I was craving more expressive power for querying and transforming data. So I started looking into building a WebAssembly plugin system to safely execute efficient transformations server-side. For visualization, I wasn’t satisfied with Grafana anymore either — I wanted to go custom there as well. So I built a SolidJS frontend with responsive plots using Observable Plot. All this started taking shape under the name observatory.
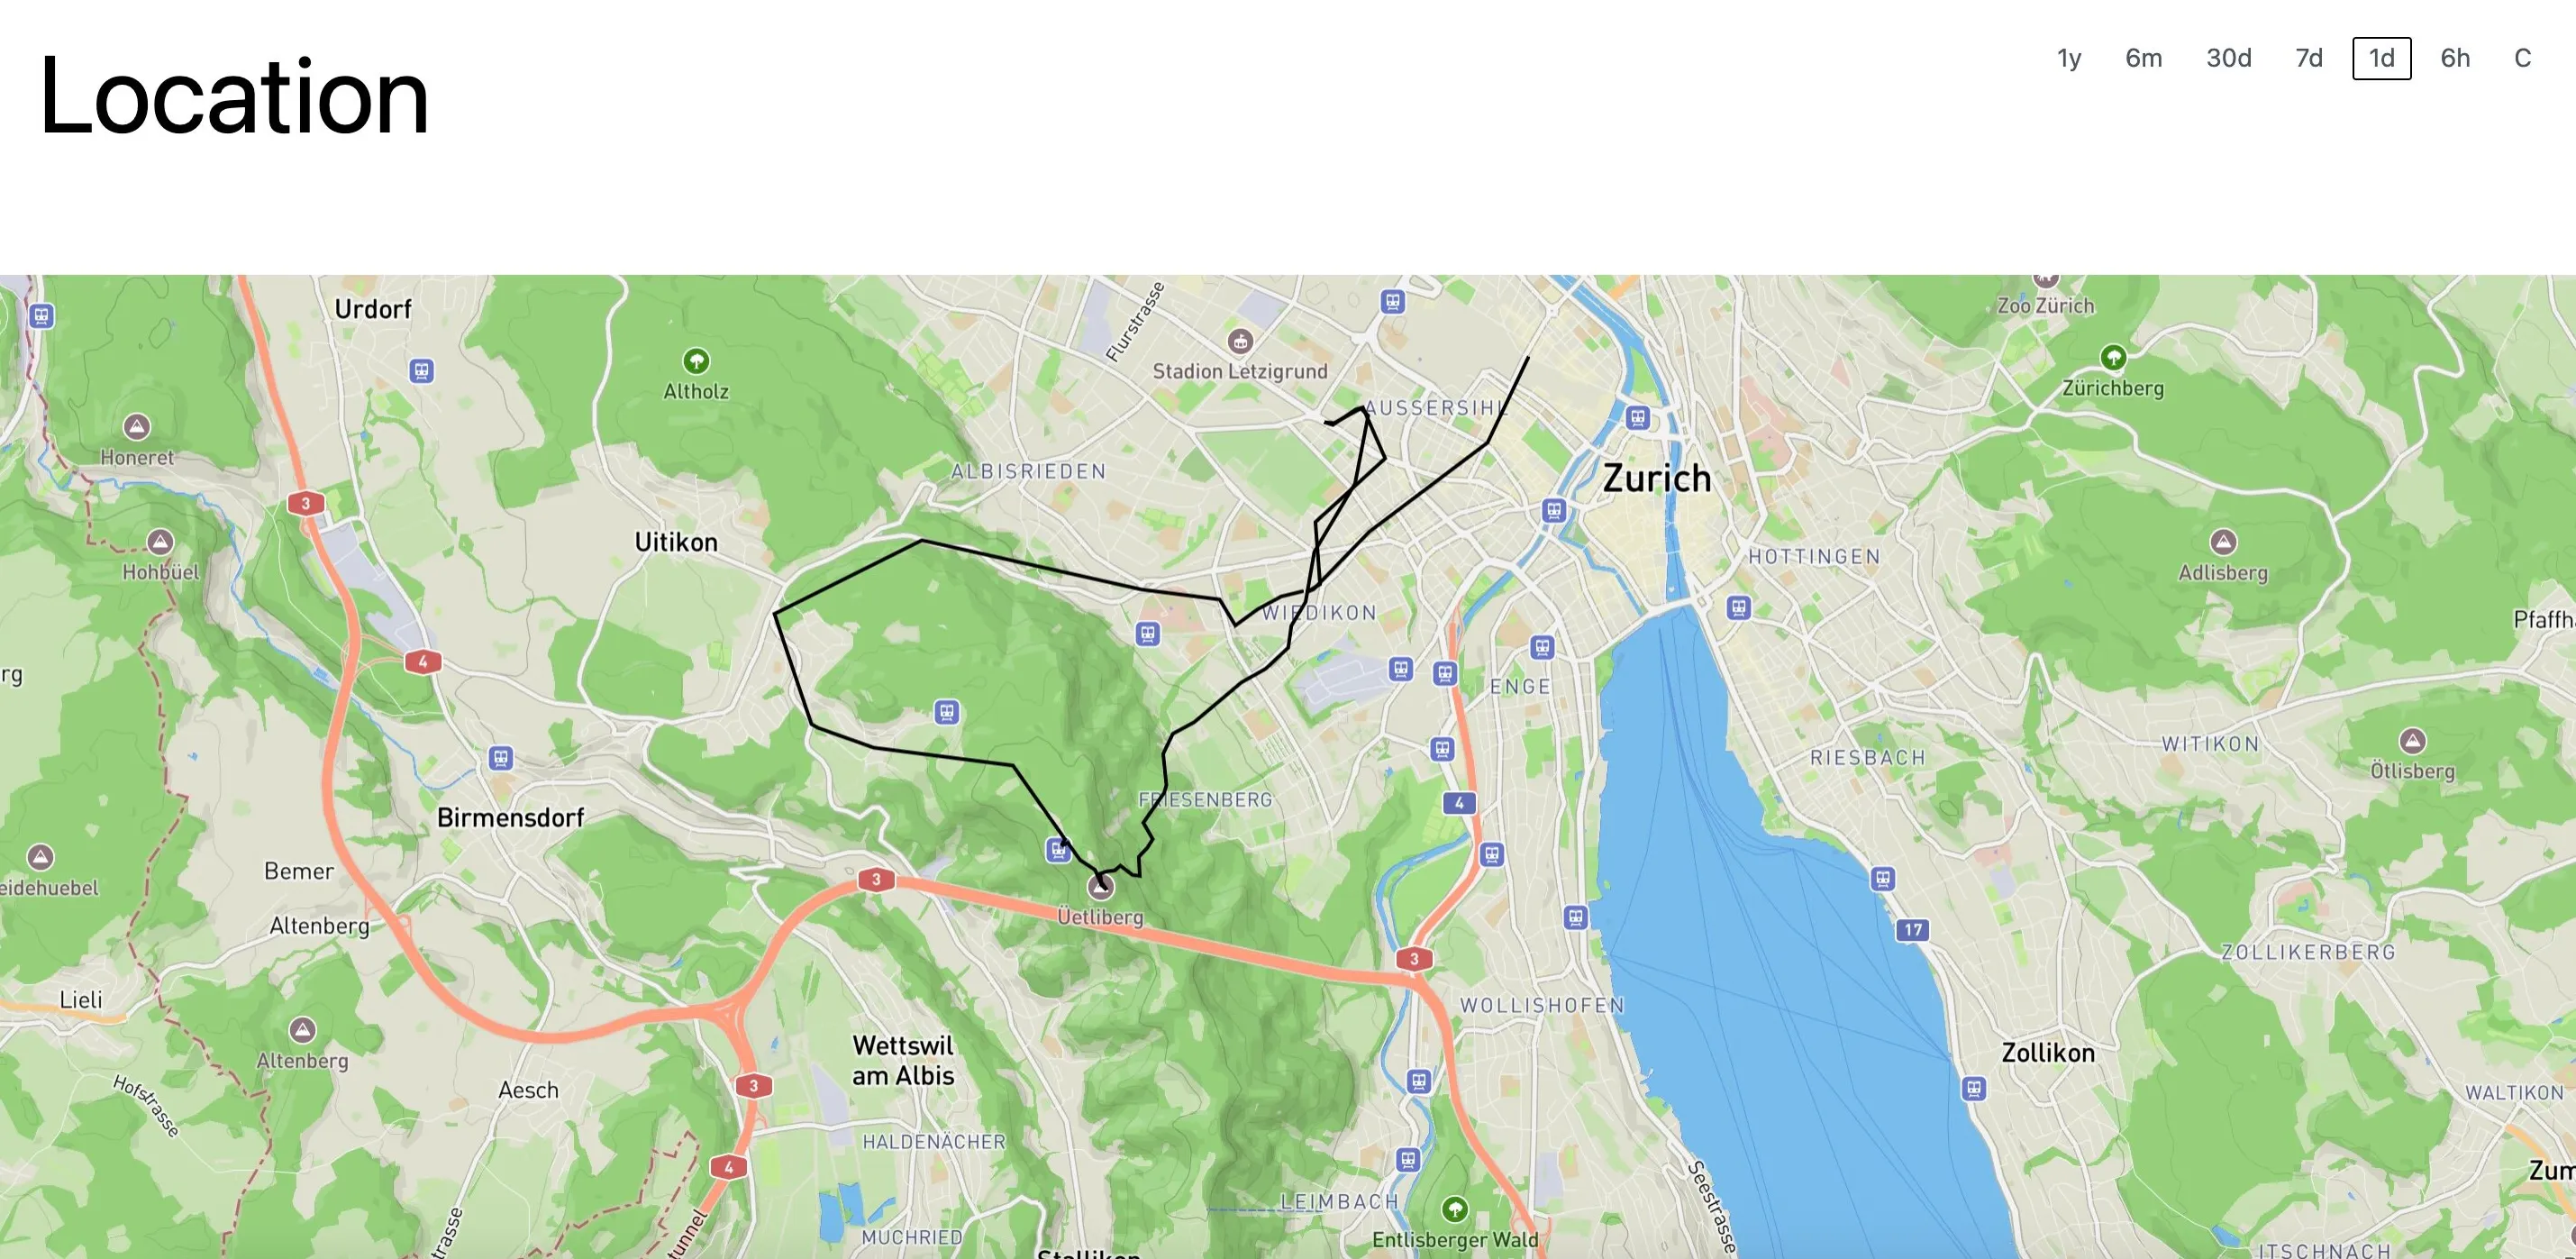
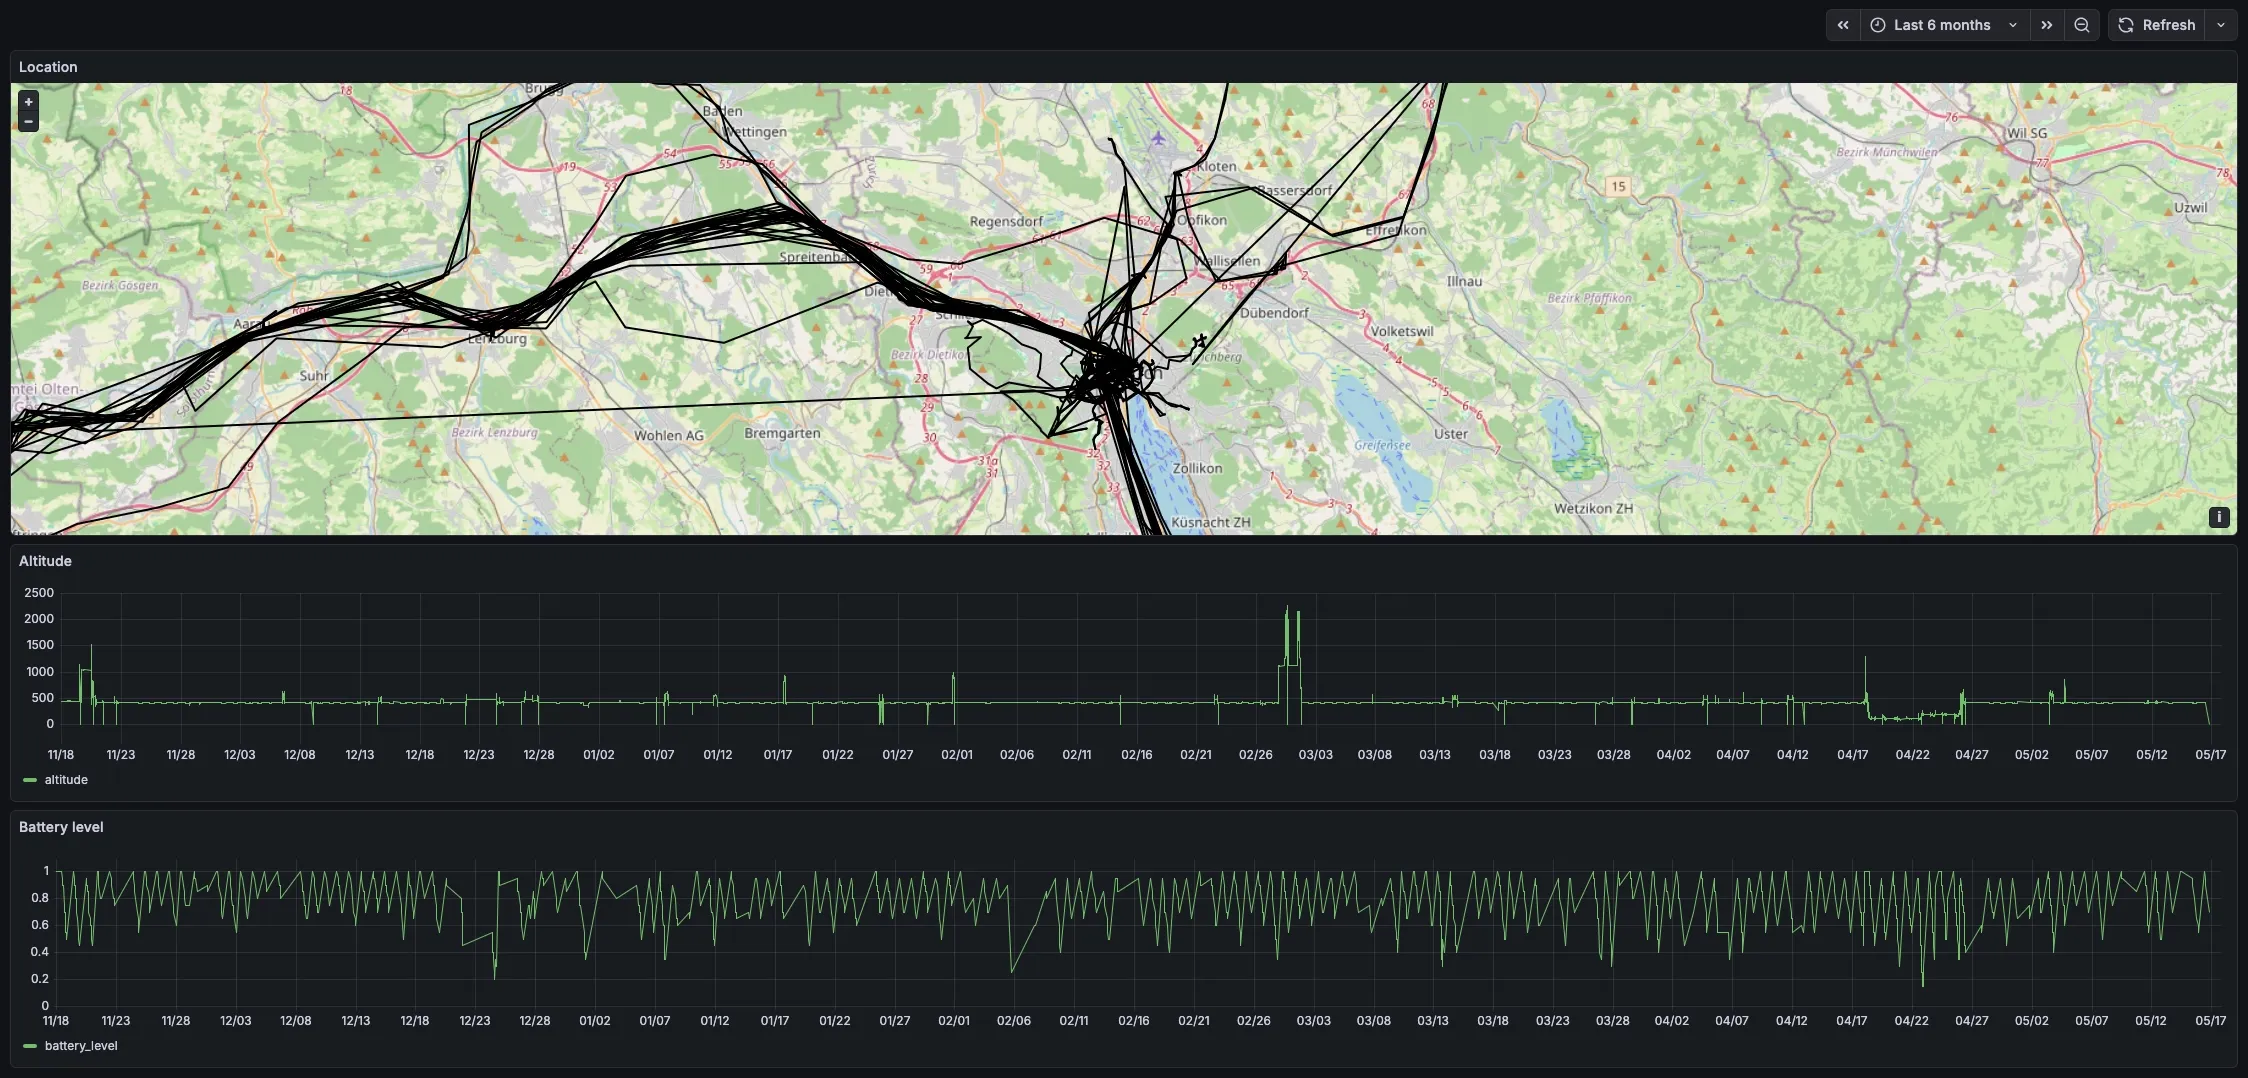
You might already be guessing that this would not go so well. Indeed, the sensor readings and GPS location data from my phone were handled fine, but I was missing a puzzle piece on how access logs fit in. How would I instrument my services in such a way as to get the data into observatory in a queryable form? I found the answer in the form of traces. At first I wanted to build a tracing collector into observatory, but that proved to be difficult. Instead, I turned towards a more off-the-shelf stack to ingest tracing data.
Act 3: Tracing with ClickHouse
When I learned about tracing — not just in the context of distributed systems, but the general concept of spans and events — I felt like I had hit the jackpot. Events you emit within spans mimic log lines, except they are naturally associated with a particular request. No correlation id needed (it’s the span id, and the tooling handles it for you). Metrics are just hardcoded aggregations done in the application, which lends itself to very space-efficient storage in exchange for limited flexibility. With traces, you can generate any metrics you might care about after the fact. Tracing is kind of a one-stop-shop for observability.
So I set up an OpenTelemetry collector that would receive traces and store them in a
ClickHouse database. That part made a lot of sense, and instrumenting my
services with the excellent tracing crate is a walk in the park. Getting that sent off
not so much, though. But now the sensor and GPS data didn’t fit the bill so cleanly
anymore. I didn’t want to have to send that data in a format the collector would understand, so I
built a small service I called events that accepts the data
and simply declares a span with the received attributes. This way, the tracing machinery in that
service takes care of getting the data into ClickHouse (via the collector).
So with this, I finally realized the dream of having one central system where all my data flows together:

So this is great. Just a couple of problems:
I don’t like OpenTelemetry because I don’t understand it. I would prefer simpler protocols, something I could build myself in a pinch. The docs are a mess, too.
I don’t like operating ClickHouse and Grafana on my server. They’re great at what they do, but I have a need for simpler software. I suffer from not-invented-here syndrome, ok?
I don’t like the way the data is laid out in the DB. I can put any data into the DB just by annotating a function with a span, no problem. But it’s very inefficient at storing, say, an 8 byte sensor value. The fact that each span is its own row also makes aggregating data across all spans belonging to one request quite tedious.
I’m craving simplicity.
Act 4: Wide events with Parquet
For more background on this, please read the preceding note on Parquet files.
Apparently other people have had the same thoughts. Some call it Observability 2.0, others wide events. I’ll give you a brief rundown; for more details and a good list of further reading, consult this blog post.
The idea is simple: for a “unit of useful work”, whatever that means for your system, collect an object with relevant properties and send it off to your observability system upon completion of the work. For a web backend, the unit of work you care about most is almost certainly the handling of a request. But it may also be the execution of a scheduled task. So for the request, you would track url, method, response status, headers, and all the usual suspects. But if you go all the way, you may even add current memory utilisation and other environmental factors.
Fundamentally, this is not that different from traces applied to a monolith. The data is just more easily queryable. And what I particularly appreciate: no need for sophisticated machinery.
The plan is, once again, simple: build a system that accepts arbitrary JSON payloads. Regularly write the buffered payloads into Parquet files. That’s it. That’s the write path. To visualize the data, I’ll build custom dashboards just like in Act 2. The storage engine enabling fast queries will be DuckDB. Instrumentation on the services should be rather straight-forward as well. All I need to do is keep track of some context throughout the handling of a request to write properties into.
What I’m hoping to achieve with this approach: a simpler wire protocol that any service and device can directly talk - just JSON. A simpler data model, plain files for easier backup. A simpler operating model, no queries, no load. More powerful and elegant visualizations. The simplicity I’ll gain of course comes at the cost of significant effort to build this system. But I’m more than happy to pay for it.
I’m writing this as I gear up to make Act 4 a reality, sorry to leave you hanging like this. Once it is done I’ll add a more satisfying resolution here. Or maybe Act 5. We’ll see.